Exploring the Billboard Hot 100 | Taylor Swift
Join me as I do some exploratory data analysis on my new data set!
As fans scramble to secure tickets to Swift’s Eras Tour, it is evident that the artist’s fame has done anything but grow over the years. Only last week, she held all of the top 10 songs in the Billboard Hot 100 with songs in her newly released Midnights album. As a recent Taylor Swift fan, I was curious to see how her popularity has evolved.
What better data to use than the Billboard Hot 100 charts? Ever since its first Hot 100 chart in 1955, Billboard has tracked the top 100 songs in the United States every week. Billboard calculates the ranking of songs based on physical and digital sales, streamings, and radio play.
A Brief Overview of the Web Scraping
I chose to scrape the data from the Billboard Hot 100 webpage, starting in June 2006 when Swift released her first single, “Tim McGraw.” If you want to see my code for this, check out this repository. In the end, I was able to get data from 2006 ‘till now. For each week during this period, I got all Hot 100 song titles, their artists, and their rankings (where #1 is the best). Because this is a lot of data to keep track of, I only kept Taylor Swift’s songs.
Using the data I collected from the Spotify API (which included individual song information like the album, release date, duration, popularity, etc.), I merged all the information I had collected for each song with the data I got from the Billboard Hot 100 (see previous post for the Spotify data). Here are the first few rows of this new table!
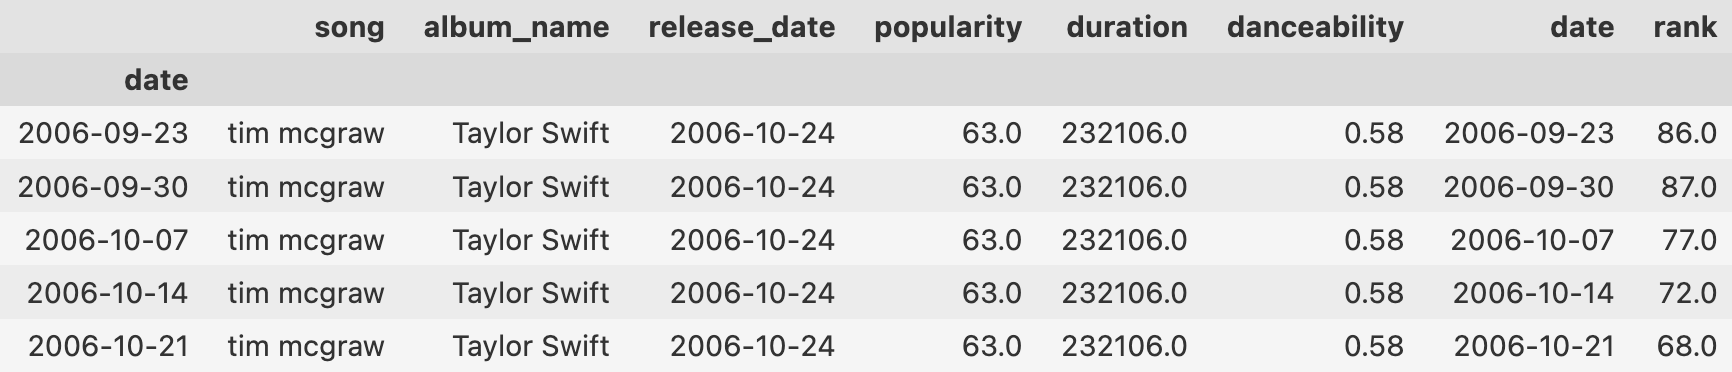
With the data wrangling finally done, I started to see what I could find out about Taylor’s Swift career over the years.
Taylor Swift Tracks in the Billboard Hot 100
This first graph is a first attempt at visualizing the success of Swift’s songs over the years. Color-coded by album, this graph shows the number of tracks per album featured in the Billboard Hot 100, averaged over three months.
Although it is difficult to show here if we change the period that we are averaging over, the trend also changes. Thus, in the next post, I hope to make an interactive graph where users can adjust the period. However, this graph shows that her success has grown since her first album in 2006. Although her re-recordings of her previous albums have not done as well, her new album, Midnights, immediately shot up in the charts. This first graph is a first attempt at visualizing the success of Swift’s songs over the years. Color-coded by album, this graph shows the number of tracks per album featured in the Billboard Hot 100, averaged over three months.
Popularity of Songs by Album
To get a more detailed look at the success of the individual songs in each album, I made the following kind of plot:
Although this only shows the songs in the album “reputation”, in the next post I will be making an interactive dashboard that will let you see the graph for each of the albums. However, from this example, we can clearly see which songs in that album were the most popular, and which ones stayed on the charts the longest.
Most Frequently Featured Tracks in the Billboard Hot 100
Next, I wanted to see which songs stayed on the charts the longest (across all albums). Although this is not a perfect metric for popularity of the songs, I think it will give a good indication of which songs remained popular for the longest time.
Tracks Ranked #1 in the Billboard Hot 100
Another way to find the most popular songs is to see which songs reached #1. The following graph shows that clearly. To me it is interesting that the only two songs that overlap are “Blank Space” and “Shake it Off”. However, this is probably because #1 is a strict requirement. I would bet that many of the songs in the graph above were in the top 10.
Most Frequently Featured Tracks by Album
This graph shows the number of times a song from the album was featured in the Hot 100. It looks as if 1989 might be the most popular album released to date!
Another Look at the Taylor Swift’s Popularity Over the Years
This is perhaps an unconventional way of showing this, but here is a heatmap showing the number of songs ranked 1-10, 11-20, 12-30, etc. This hopefully will illuminate some trends in Taylor Swift’s popularity.
For example, it seems that 2015 was a big year for Taylor Swift! The year before she released 1989, arguably one of her most popular albums.
Stay Tuned…
This has been a very brief overview of some of the data exploration I have done so far. In the next post, I anticipate showcasing more polished research and graphics. Thanks for tuning in and please comment below if you have any ideas of what I should explore next with this data!